Energy production in the United States has changed quite a bit over the last 20 years, and what is most compelling is that it has grown in almost every field – demonstrating a strong and growing energy economy.
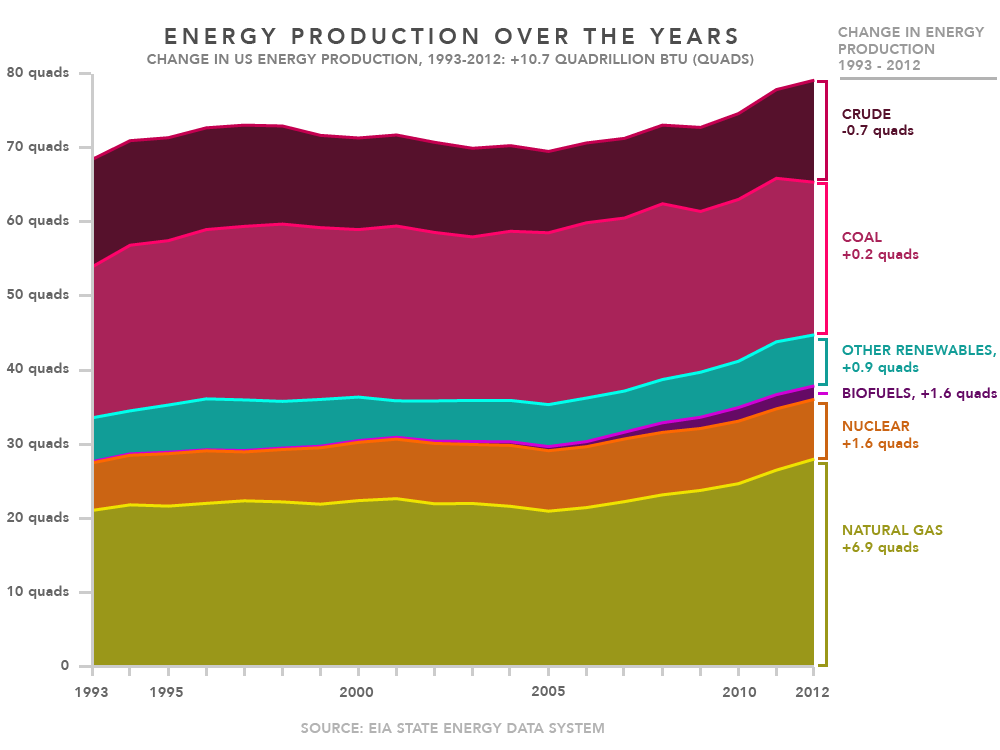
According to Energy.gov, U.S. energy production has increased by 16% between 1993 and 2012, which they illustrate in their graph below. The unit of energy used is called quads (quadrillion BTU). Some common equivalents to 1 quad are 8,007,000,000 gallons (US) of gasoline, 293,083,000,000 kilowatt-hours (kWh), and/or 970,434,000,000 cubic feet of natural gas.
Energy.gov does not have total data from the past two years, but recognizes that nuclear energy has grown steadily, while other types of energy have experienced volatile production year-to-year, such as coal and renewable energy. Virtually non-existent biofuels in 1993 have grown from 0.17 to 1.8 quads and natural gas has increased by 33% from 2005-2012 alone.
The increased production of energy means good things for American families and small businesses as it creates more jobs, lowers costs, and reduces our dependence on foreign countries. The House Committee on Natural Resources note that for every penny the price of gasoline increases, it costs consumers an additional $4 million per day ($1.4 billion over an entire year). This is prevented by the United States producing its own energy resources – oil, natural gas, coal and nuclear, as well as alternative sources such as wind, solar, hydropower and geothermal. With that, the proof is in the numbers that we are on the right track to doing so.